Video Recorded: August 13th, 2024
We are including in this writeup the visuals we discussed in this episode of Random Gleanings – you can find our video updates at www.youtube.com/@proplanwealth any time you’d like.
The charts we share come from economic and market topics that we think are interesting and are part of the story as it relates to investment portfolios. We don’t intend them to be “The Gospel”, but simply part of the story and things that may be worth keeping an eye on.
With that, here are this week’s charts! You can watch the video for more content on each chart, and click on them for a larger view.
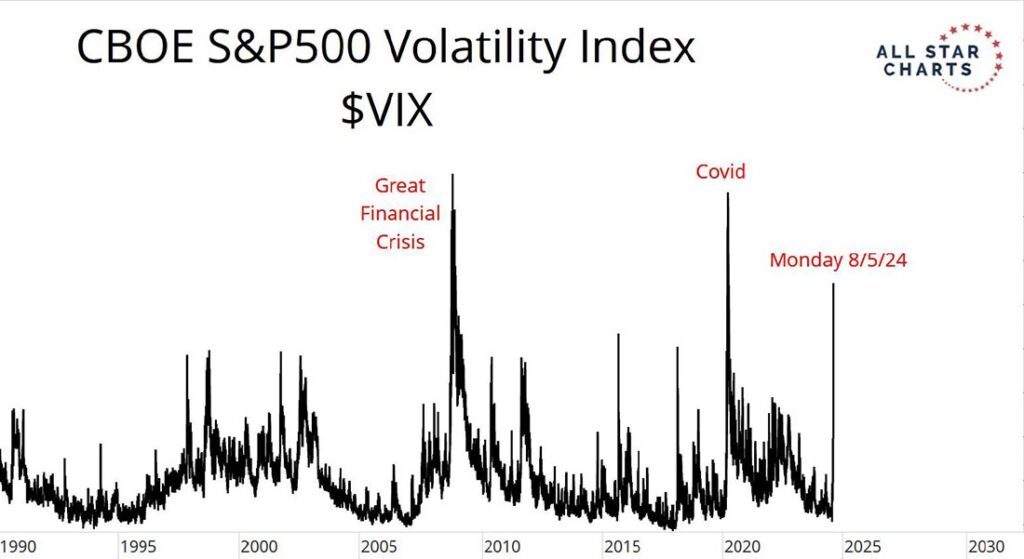
As Ron Burgundy (from the movie, Anchorman) said, “Well, that escalated quickly.” Monday, August 5th, saw the third highest volatility measure on record. The guys discussed that the unwind of an esoteric hedge fund strategy – the “Yen Carry Trade” – was the powder keg on that Monday, after some softening data was reported in the prior week. The Market opened down 6% or 7%, but closed the day less than half that bad… and has resumed its bullish behavior since.
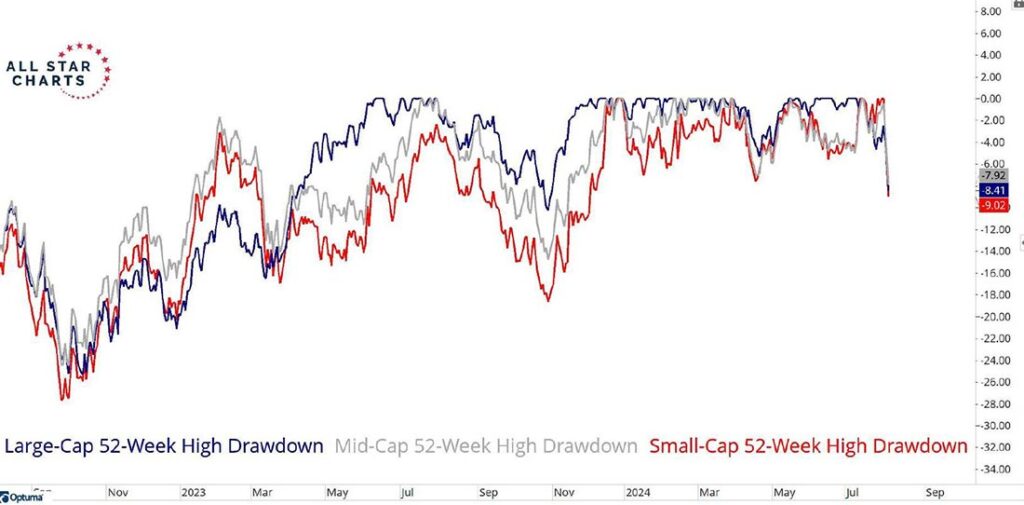
This chart offers a look at the pace of the move from the mid-July 52-week highs through the 5th of August, but also serves as a reminder that markets simply aren’t achieving new highs on a daily basis. In fact, it has been reported that markets have traded at all-time highs only 6.7% of the time since 1950. In other words, 93.3% of the time, market investments will be below some prior high. Recognizing this dynamic about markets can serve to keep us all invested, because, of course, the long-term trend has served investors well.
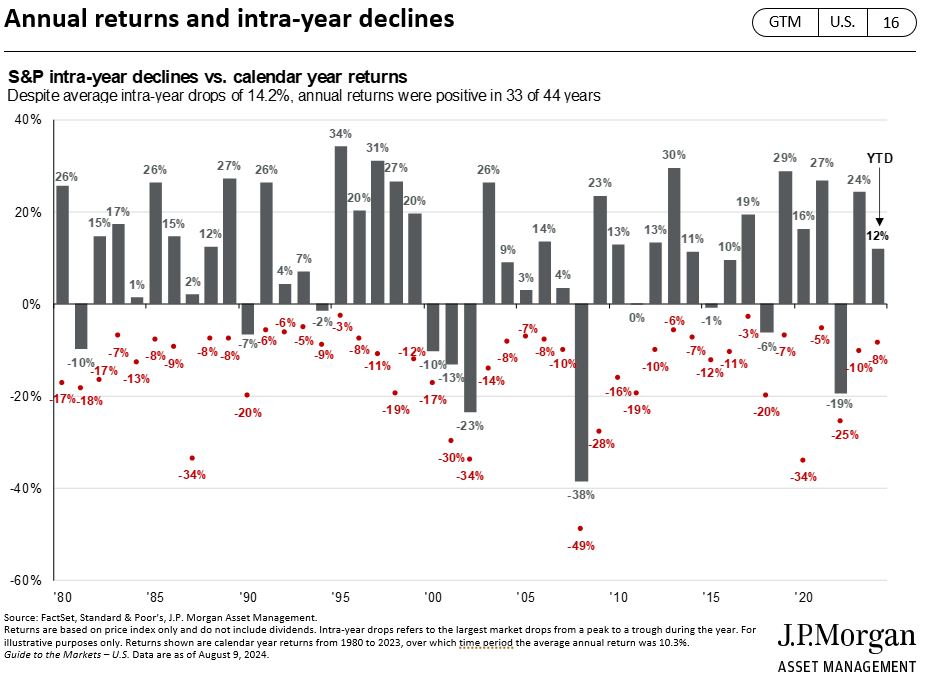
Here’s another helpful chart. What you can see above is that there are far more positive grey bars (33 of 44) reflecting POSITIVE Years in the market. However, the red dots show how at some point in each and every year the market hit a high and pulled back. The average INTRA-YEAR pullback has been 14.2%. Chris makes the point that the recent 8% move of the recent highs looks an awful lot like some pretty strong years back in the 80’s secular bull market.
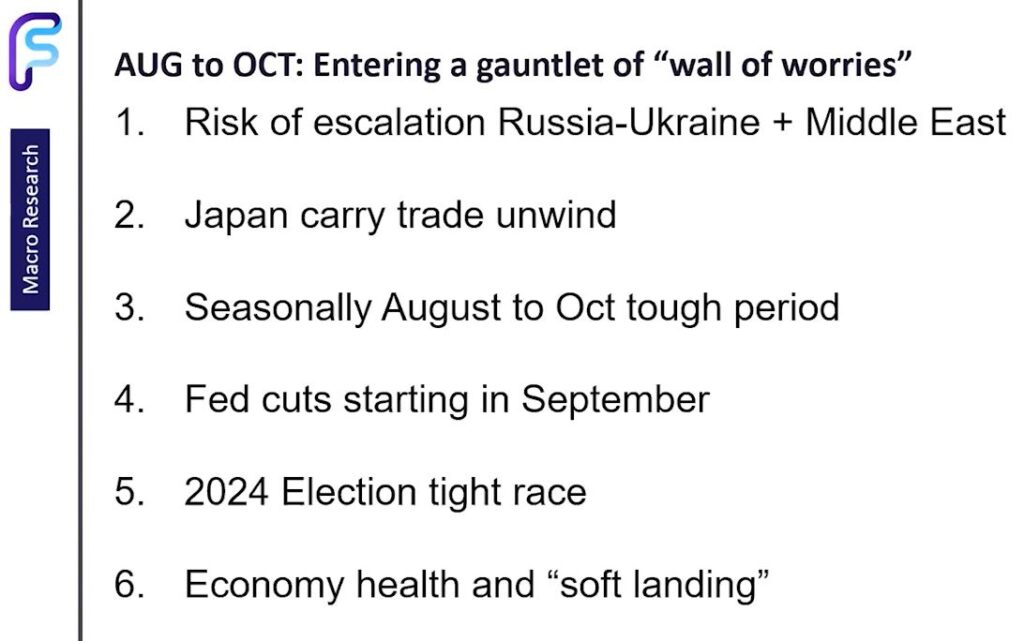
Research firm Fundstrat, acknowledging the historically seasonal challenge for markets between August and October, shares their list of “wall of worries”. What is not said in the slide above is that markets tend to climb these walls of worry since most market participants themselves are aware of the same concerns, it tends to be priced into the market price. Outside of a big surprise in any of these “worries” their resolution generally ends up less damaging than the initial concern.
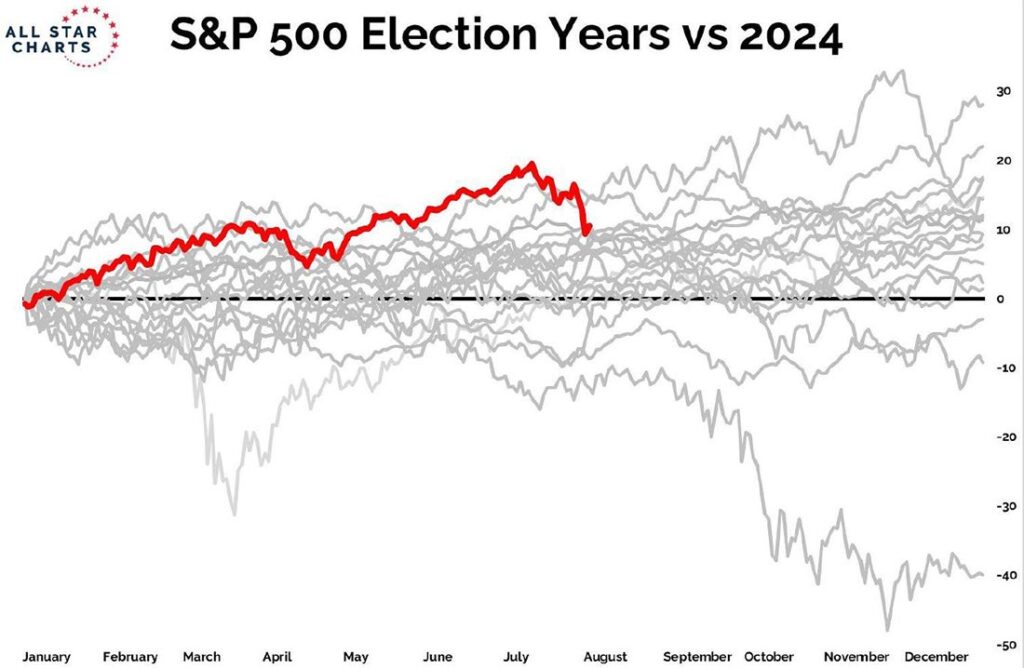
From an election year historical perspective, the guys spoke to the fact that up until late June, the markets were on pace to be the best ever election year from a return’s perspective. As such, the recent pullback seems to put it in a position where it would not be unusual to potentially see some modest growth through the end of the year.
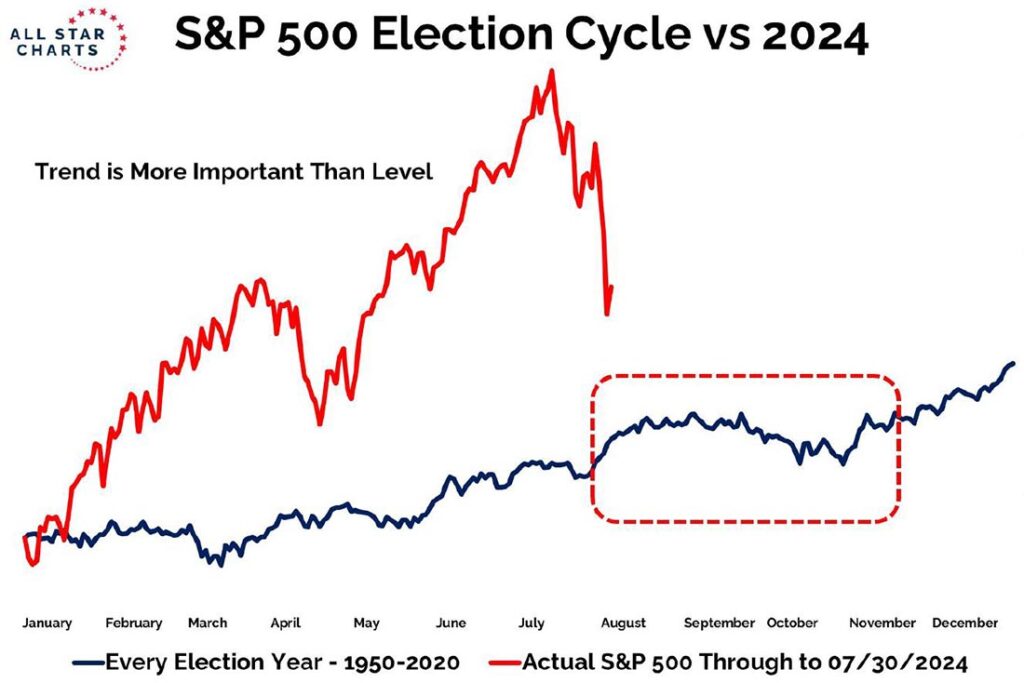
Another view, again offered by All Star Charts, shows the seasonality of the market in an election year. Given the comment, “Trend is more important than level”, made by the strategist, he is implying that from August to election day, some mild or nominal growth would be the historical norm, before normally finishing the year strong. Chris made the point that this year’s chart continues to show higher lows, which would imply (though not guarantee) that the trend is still intact.
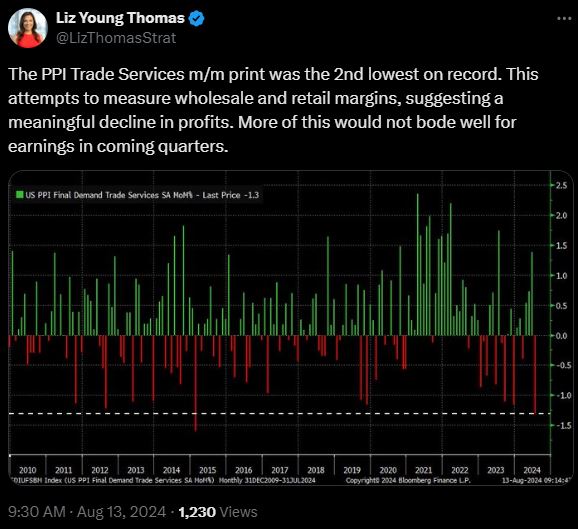
Moving to some inflation data out this week, Liz Young Thomas, raises her eyebrows at the Producers Price Index (wholesale) numbers that came in on Tuesday. While the guys discuss that this data can get a bit noisy, it is worth paying some attention to if the trend continues to deteriorate. That said…
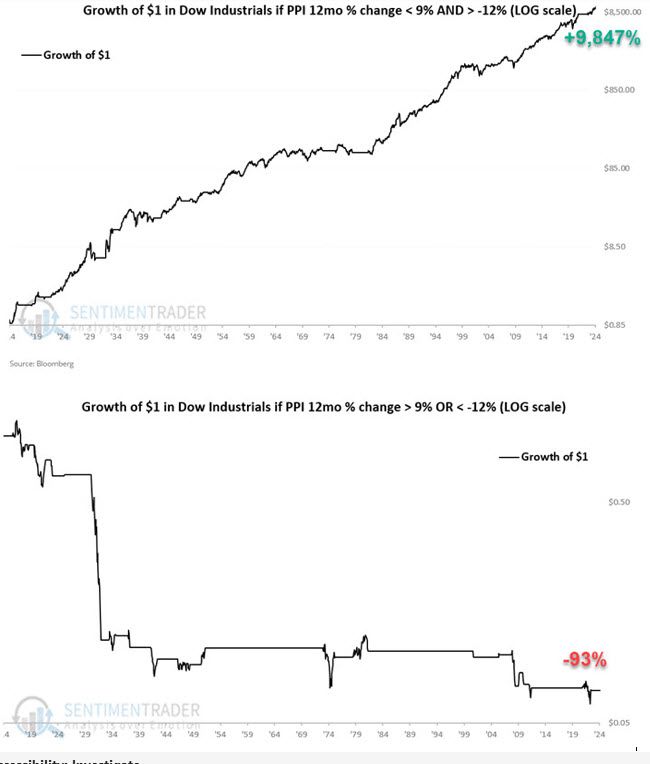
… Market analysis firm, Sentimentrader, suggests that PPI data at extremes may need to be heeded, but within those extremes it would not seem to benefit trading on this information.
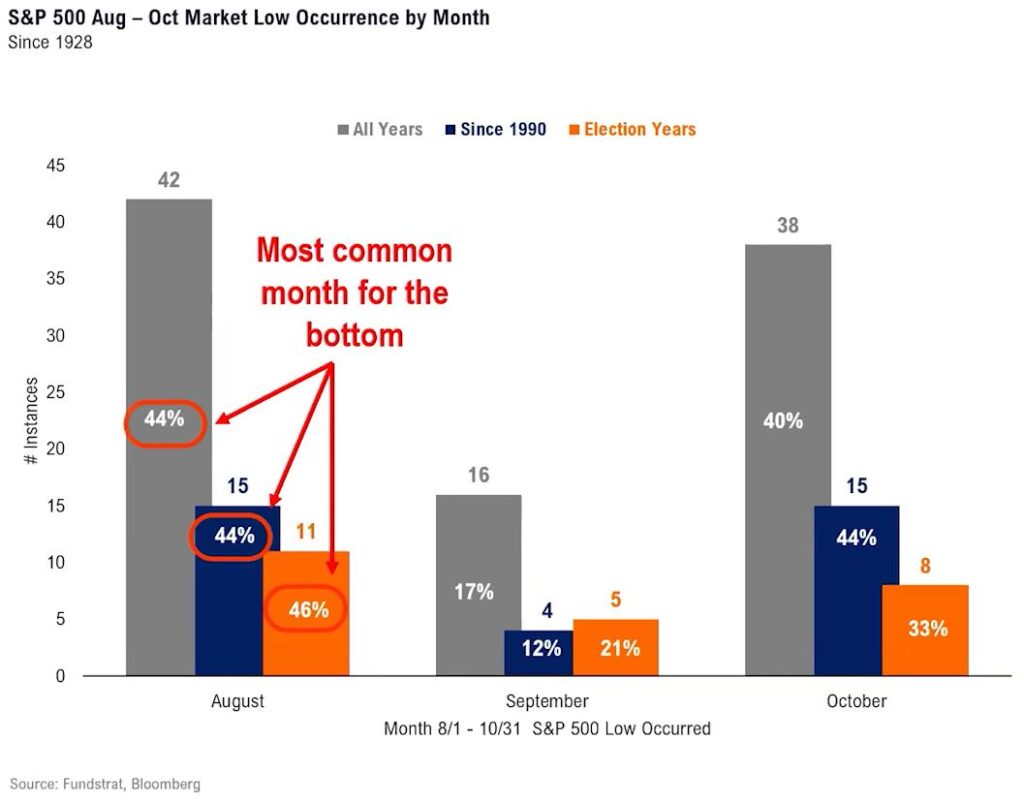
Back to the topic of the historical challenges of this seasonal period of August – October… Fundstrat and Bloomberg show that within this tough stretch of the year, August has seen the “worst of it” more times than September or October. So… perhaps the early August ugliness was the worst??? We’ll see… and of course, we’ll be paying attention.
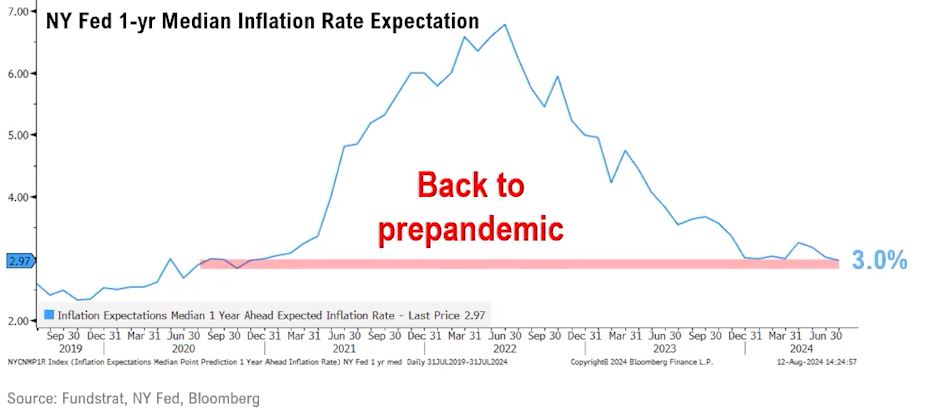
Ending on a positive note, one of the biggest concerns for the Fed was the idea of high inflation becoming entrenched in the eyes of consumers. When this is the case it makes lowering inflation that much harder, as it becomes a bit of a self-fulfilling prophecy of higher and higher inflation. With year-over-year numbers now having come back down to 3%ish again (still off the Fed’s target of 2%, but much improved) the Expected Rate of Inflation is back to where it was prior to the gnarly rise of ’21-’22. This is a good development.
Thank you as always!