Hey friends, let’s talk about what you do if you want to invest but you’re reading that markets may be a little more expensive. Welcome to today’s ASAP Finance.
Market Overview:
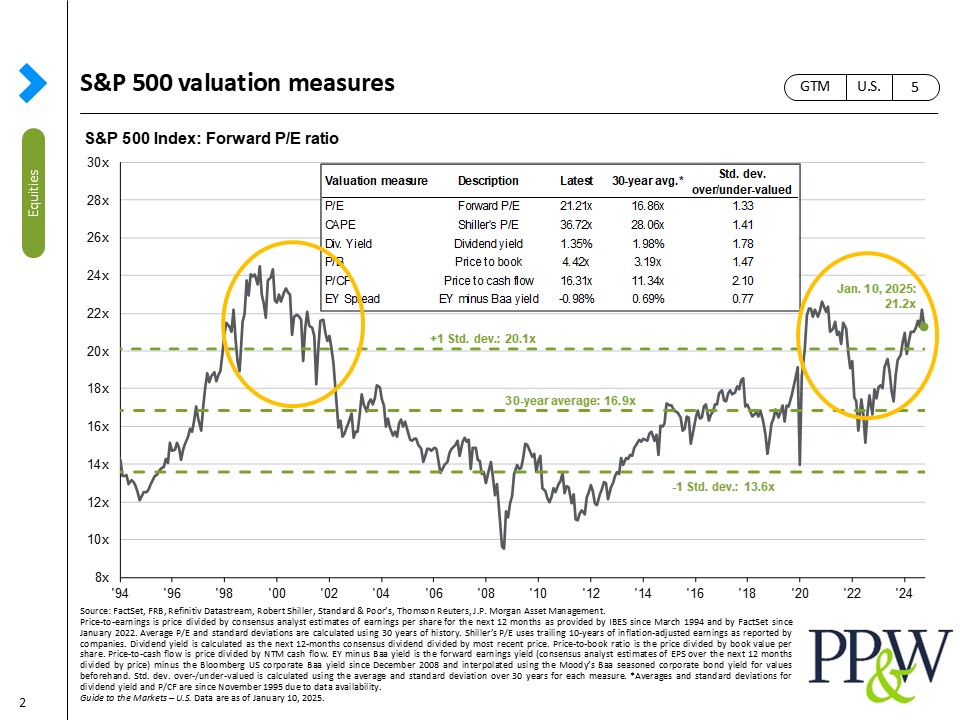
If you read anything from year-end 2024, you’ll probably read that markets have been on a tear, or at least US large companies. Let’s look at pricing today versus the past.
Chart Analysis:
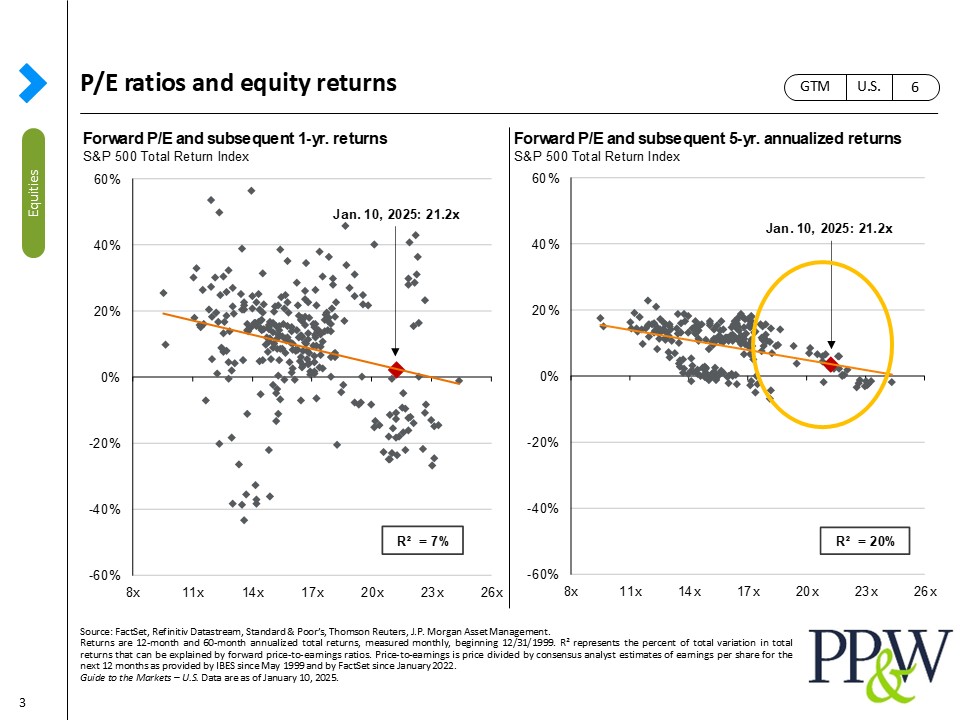
On this next chart (below, left), on the left-hand side, you’ll see a circle that shows the S&P 500 at kind of an elevated price in terms of price-to-earnings ratio. On the right-hand side, you’ll see we have that circled as well. Now, it’s not as high as it was in the 1990s, but it’s a little bit elevated. Let’s look at what that means for forward returns on the right-hand side (below, right). This is a chart courtesy of our friends at JP Morgan. What they’re essentially saying is, hey look, five-year average annual returns may be a little more muted in nature.
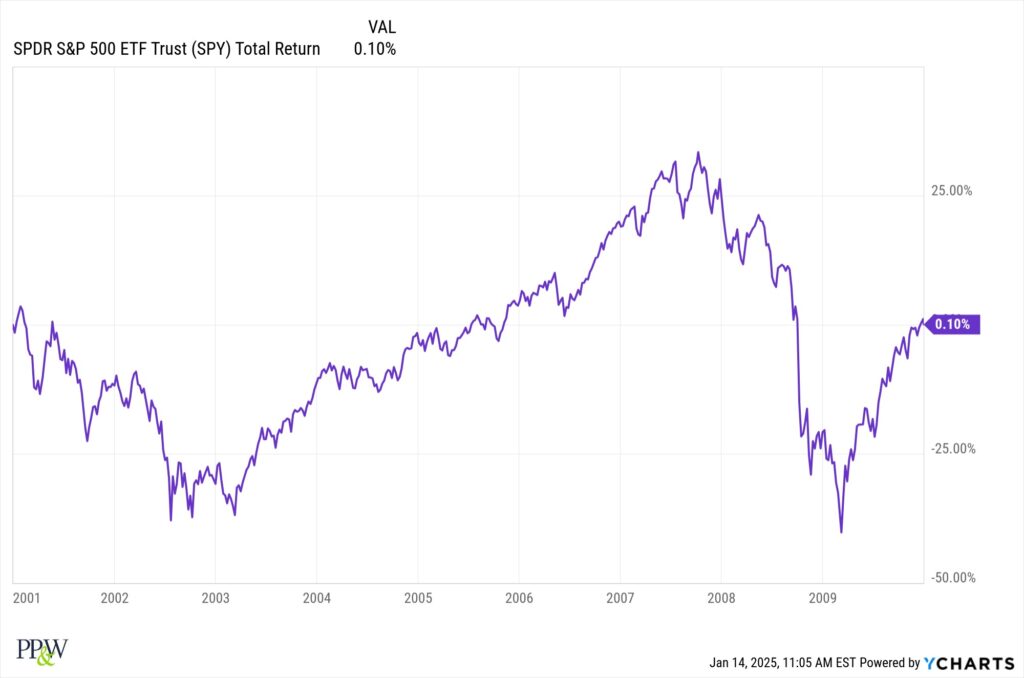
If you’re investing for the future, let’s go back and look at one of the worst decades in the last 100 years, and that’s the 2000s. If you would have invested on December 31st of 2000 and held that investment through the next 10 years, your grand total return would have been 0.1%. That’s not an average annual return; that is your total return for the whole period.
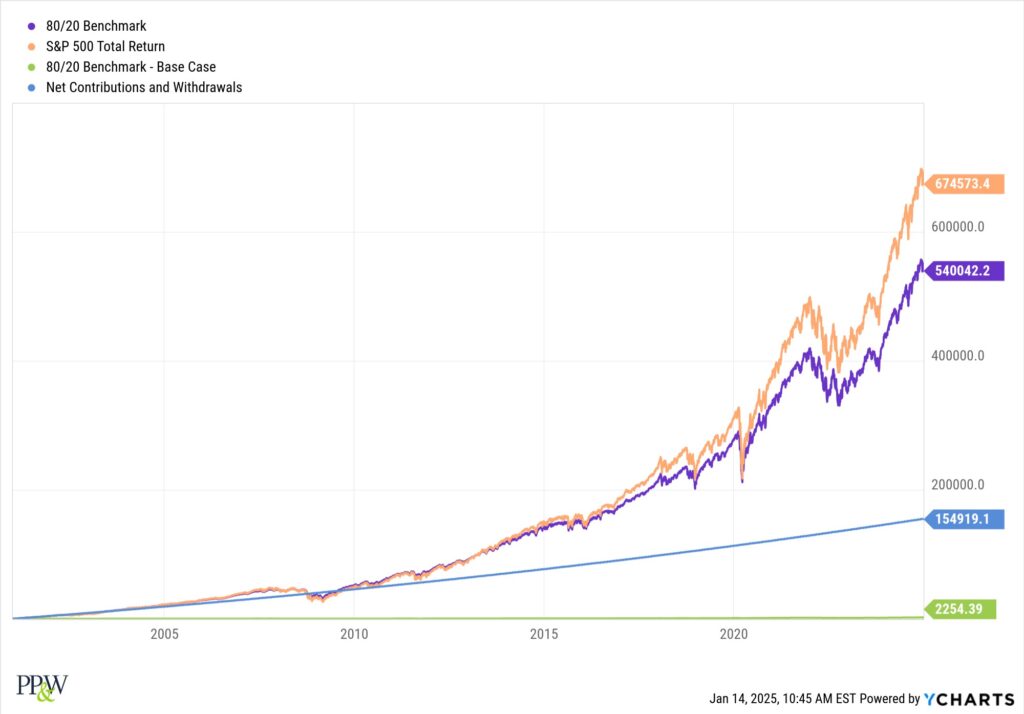
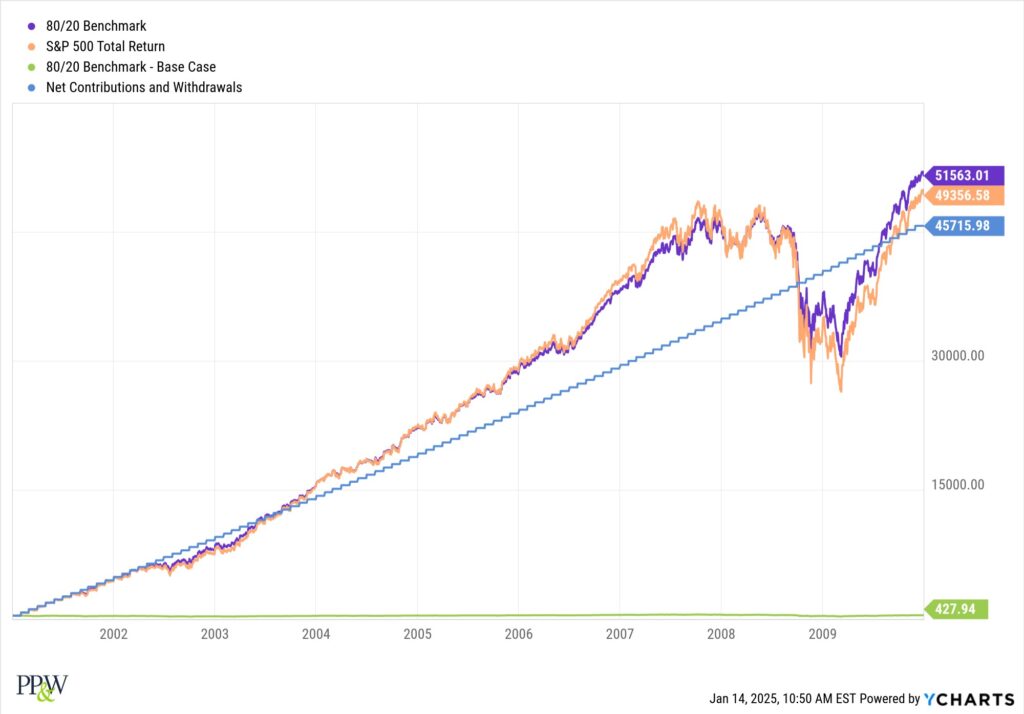
What happens if you just begin dollar cost averaging as well? This is an example of someone making $50,000 a year, putting 5% in their 401k plan, and getting a 4% match. Essentially, what would happen if you put it in an 80/20 asset allocation fund is that you would have roughly a 14% return just by virtue of dollar cost averaging, and that’s through the exact same time period.
Now, what would happen if we applied the exact same logic not just for the 10 worst years but then the subsequent 15 years as well? So, the last 25 years in total. Basically, if you started at 5% of your income, 4% match, and you escalated that by 3% a year, you would be at $540,000 by the end of that time period. That’s awesome! To be specific, that is a 10.42% average annual return through the entire time period. It’s a good number for the future.
Conclusion:
The point is, listen, bad decades and bad times ultimately lead to the ability of continuing to contribute and make hay with those lower prices. In fact, the final chart here is a chart again from our friends at JP Morgan. This is the last 44 years. The gray bars represent calendar year returns, and the dots represent intra-year pullbacks, meaning it could be really through any time period during the year. But ultimately, those are the pullbacks, those are buying opportunities, and if you just keep dollar cost averaging, it will work over time.
Closing:
Thanks for watching. We’ll see you soon.