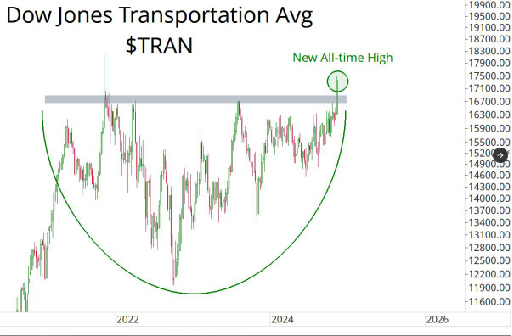
After bumping up against the all-time high resistance ceiling a couple times, the Dow Jones Transportation index has made a convincing move above the levels not seen since late 2021.
Video Recorded: November 12th, 2024
We are including in this writeup the visuals we discussed in this episode of Random Gleanings – you can find our video updates at www.youtube.com/@proplanwealth any time you’d like.
The charts we share come from economic and market topics that we think are interesting and are part of the story as it relates to investment portfolios. We don’t intend them to be “The Gospel”, but rather simply part of the story and things that may be worth keeping an eye on.
With that, here are this week’s charts! You can watch this week’s Random Gleanings for more content on each chart.
Whether you would like to attribute the positivity in the market over the last week to the Republican sweep, or simply to the clarity that comes once an election is over the move was big and swift. With it came some new all-time highs in parts of the market that hadn’t seen some for a while, a couple bullish technical signals, and a headscratcher of a breakdown in Gold. Looking forward, the question is what effect might the agenda promoted on the campaign trail have on markets for the new regime taking over the white house. The guys discussed all of the above in this episode of Random Gleanings.
After bumping up against the all-time high resistance ceiling a couple times, the Dow Jones Transportation index has made a convincing move above the levels not seen since late 2021.

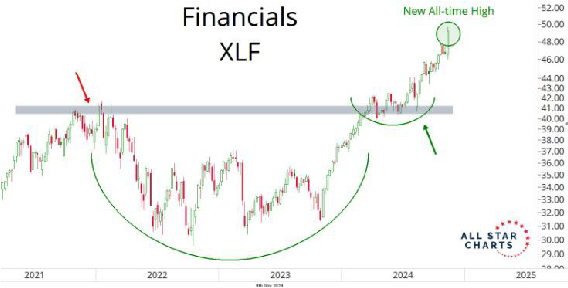
Meanwhile, while the Financial sector had crested the late ’21 highs earlier this year, the move began to sputter some in mid-October before blasting higher after the election. A move likely coming from investors anticipation of an environment of loosening regulation.
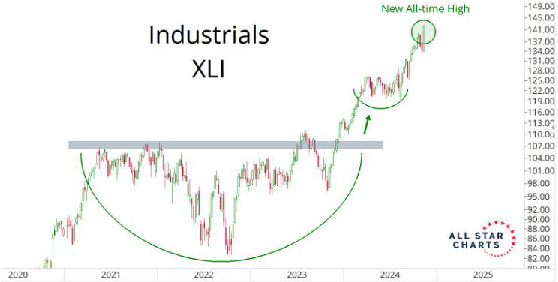
As with the Financials sector, Industrials had been in an uptrend that began to peter-out in the middle of October, however with the results of the election it would seem that the market’s opinion on the industrial sector has changed.
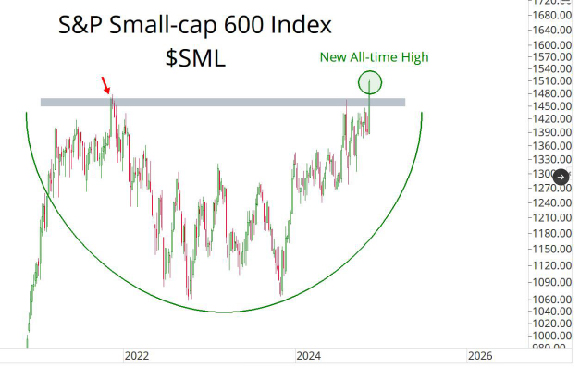
Small-Caps looks more like the Transports in the first chart, having just now broken above their late ’21 highs. This may point to rates creeping down, but the break-out on the election suggests there’s more to it than just rates.
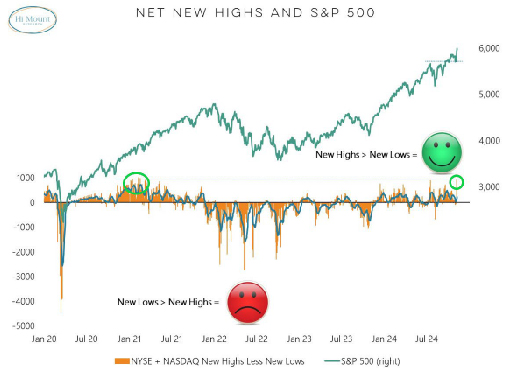
A bullish signal in the market is this chart from Willie Delwiche of Hi Mount research. In it he shows how when Net New Highs are as strong as they’ve been in the last week, it isn’t a time to be overly concerned about the market rolling over, but rather indicates some strength going forward.
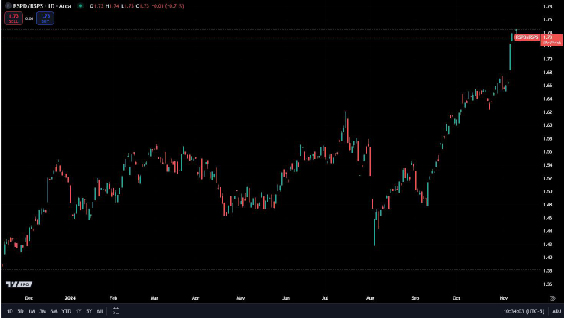
A chart that’s been looked at before on Random Gleanings, Chris shows the ratio chart of Equal Weight Consumer Discretionary stocks over Equal Weight Consumer Staple stocks. The sharp rise in the chart indicates that Consumer Discretionary (Lifestyle Wants) is outpacing Consumer Staples (Lifestyle Needs) which is a strong signal that consumers aren’t worried about their spending.
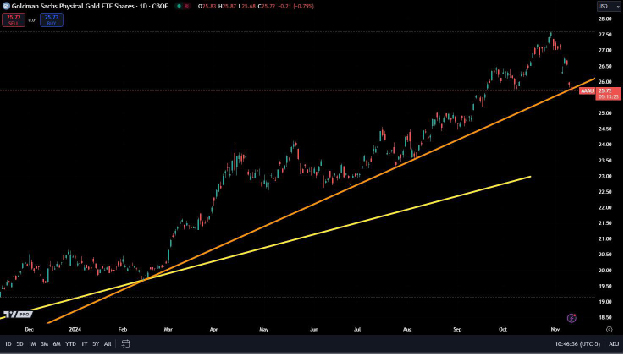
Moving in the opposite direction since the election, even violating it’s nearer term trend (orange line) Gold has sold off since the “red wave”. Admittedly, for Jesse & Chris this negativity on the shiny rock has been a headscratcher given the concern of inflation remaining sticky, and adversarial nations (read: China) having been buying up the precious metal to hold an asset that the US cannot freeze for trade (read: US Dollar), not to mention the number of smart macro economists pointing to Gold as a desired asset class under these conditions. Given the Trump administrations tendency to rattle sabers one would think gold would be that much more desired by other central banks.

One such macro strategist, Warren Pies (3Fourteen Research) referenced famed Hedge Fund manager, Paul Tudor Jones (PTJ) in the tweet above, and was on the record in the referenced podcast as suggesting Gold was on it’s way to $3,000 per ounce.
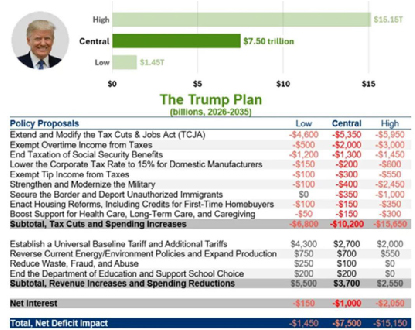
Moving beyond the recent moves in the market, Chris & Jesse spent the remainder of their discussion covering the highlights of what they’ve seen, heard, read or gleaned as to how this second Trump presidency could affect markets. Jesse noted that the discussion was not intended to be political in nature, but an attempt to take the Trump agenda at face value based on what was said during the campaign. The chart above shows the projections of how the proposed policies might COST (Red Font) or BENEFIT (Black Font) the Federal Government over the 10 years between 2026-2035. Chris pointed attention to the middle “Central” column for discussion.
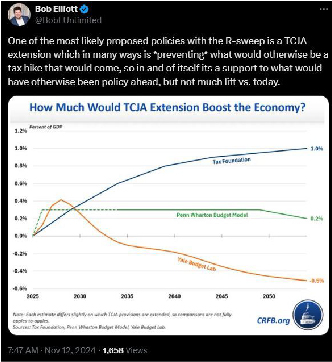
As opposed to when the Tax Cuts & Jobs Act was made law in 2017, the expected extension of what has been the tax law for the last 7 years is estimated to have little impact to GDP moving forward. Jesse, suggesting he’s happy that taxes aren’t going higher reiterated Bob Elliott’s tweet that the counter factual of the law sunsetting and taxes going up though would have likely had a negative impact on GDP. That said, considering the minimal GDP impact against the estimated cost of these extensions (last page first line) will likely be a storyline to keep up with.
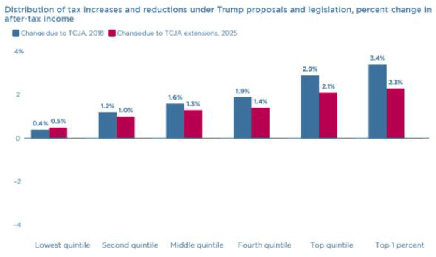
This chart indicates that the extension of the tax cuts is expected increase the “after-tax income” for all income earners (red bars), like it did when it started only to a lesser degree. The one exception of income earners who are expected to benefit more than last time are the lowest quintile earners. From an economic perspective this category of earners are most likely to have this extra income be recycled directly back into the economy, which is a positive for growth.
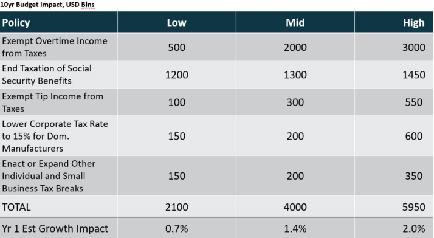
The graph above notes what many believe to be the most likely to stimulate growth based on what the Trump campaign touted on the campaign trail. Chris noted how surprising the projected cost of line #1 (Exempting Income Taxes from Overtime pay) would be to the governments income ($2 TRILLION over 10 years), but that if the estimated 1 year growth impact on GDP of 1.4% would certainly be a boost to the market. Whether Congress will pass all these initiatives, given their costs is to be figured out next year.
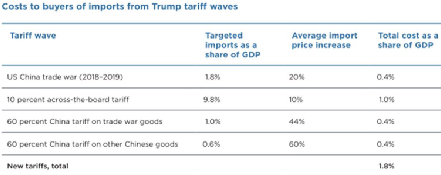
Agenda points that the market would likely be considered negative are mostly associated with the talk of tariffs. The chart shows what Trump proposed while campaigning, which if all initiatives came to fruition would be estimated to reduce GDP by 1.8%. In other words, it effectively cancels the GDP boost of the lower tax initiatives.
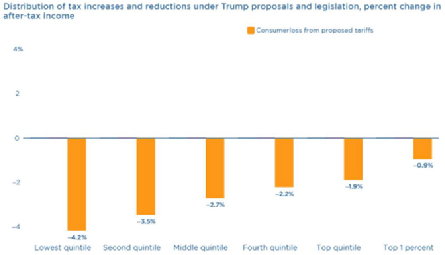
And, unfortunately the tariffs would disproportionately affect folks more the lower their income is. We’ll have to see whether tariffs ultimately come to fruition or it is more of a negotiating tactic for better trade deals??
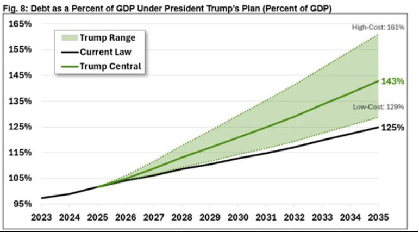
At the end of the day the expectation is that the debt in Washington is expected to climb under the proposals of the Trump campaign. In an ideal scenario GDP growth would be strong enough to reduce (or at least maintain) the ratio modeled in the chart, but that’s not what is necessarily anticipated. While the effect of this governmental debt on the stock market is unlikely to have a negative effect on stocks in the near-term, it may be a different story for bonds. Either way, it will be a topic to Chris and Jesse will be discussing into the future.
If you’d prefer to watch this episode, or those previously recorded, please find them, and subscribe, to the PP&W
Thank you as always!
